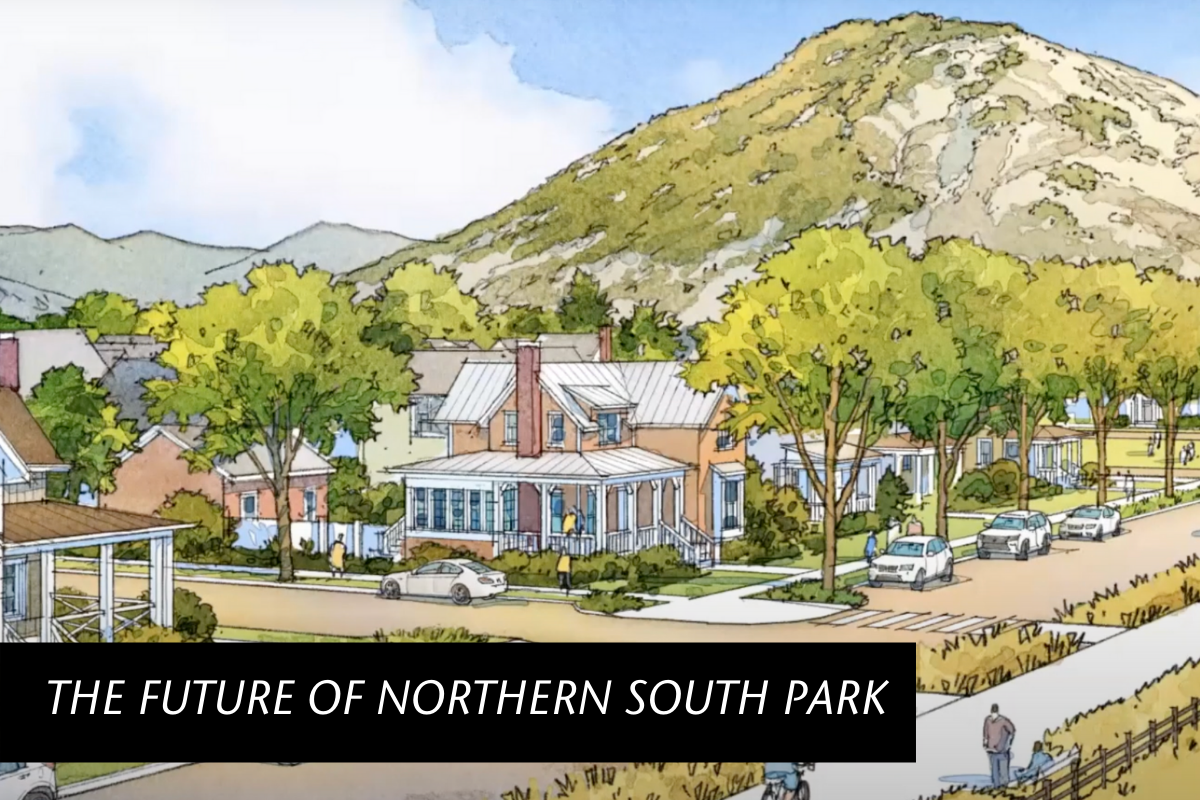
We support a neighborhood in Northern South Park that honors our ranching heritage, respects the needs of our essential workers, and sustains healthy wildlife populations.
After months of work, the county’s consultant Opticos released three alternatives for Northern South Park build-out this week, ranging from 668 to 2,381 homes.
These are just preliminary ideas, and the county planning department wants your feedback before they create one adjusted alternative for the county commission to vote on. You can learn more here: https://northernsouthpark.konveio.com/.
We are just starting to analyze the alternatives and are sharing our initial reactions in case they help you ask good questions and share your feedback. The Opticos presentation outlined laudable goals including making it possible for median income earners to stay in our community and providing wildlife permeability. However, the alternatives may not meet these goals.
Ultimately, whether the county moves ahead with a Northern South Park rezone should depend on whether the rezone meets our community goals. If not, we should pursue other opportunities to build housing that local workers can actually afford.
At this point, we see four major issues in the alternatives:
- Homes aren’t actually affordable to most local workers.
- The affordable homes might never get built.
- The “open space” doesn’t work for wildlife permeability.
- New roads could cause more sprawl and more traffic.
1. Homes aren’t actually affordable to most local workers.
New homes should serve the full range of local households’ income levels. Currently, all the alternatives over-supply for households earning 250-350% of median income (meaning up to $280,000 for a single person or $400,000 for a family of four), and significantly under-supply for households earning median income ($80,000 for a single person or $116,000 for a family of four).
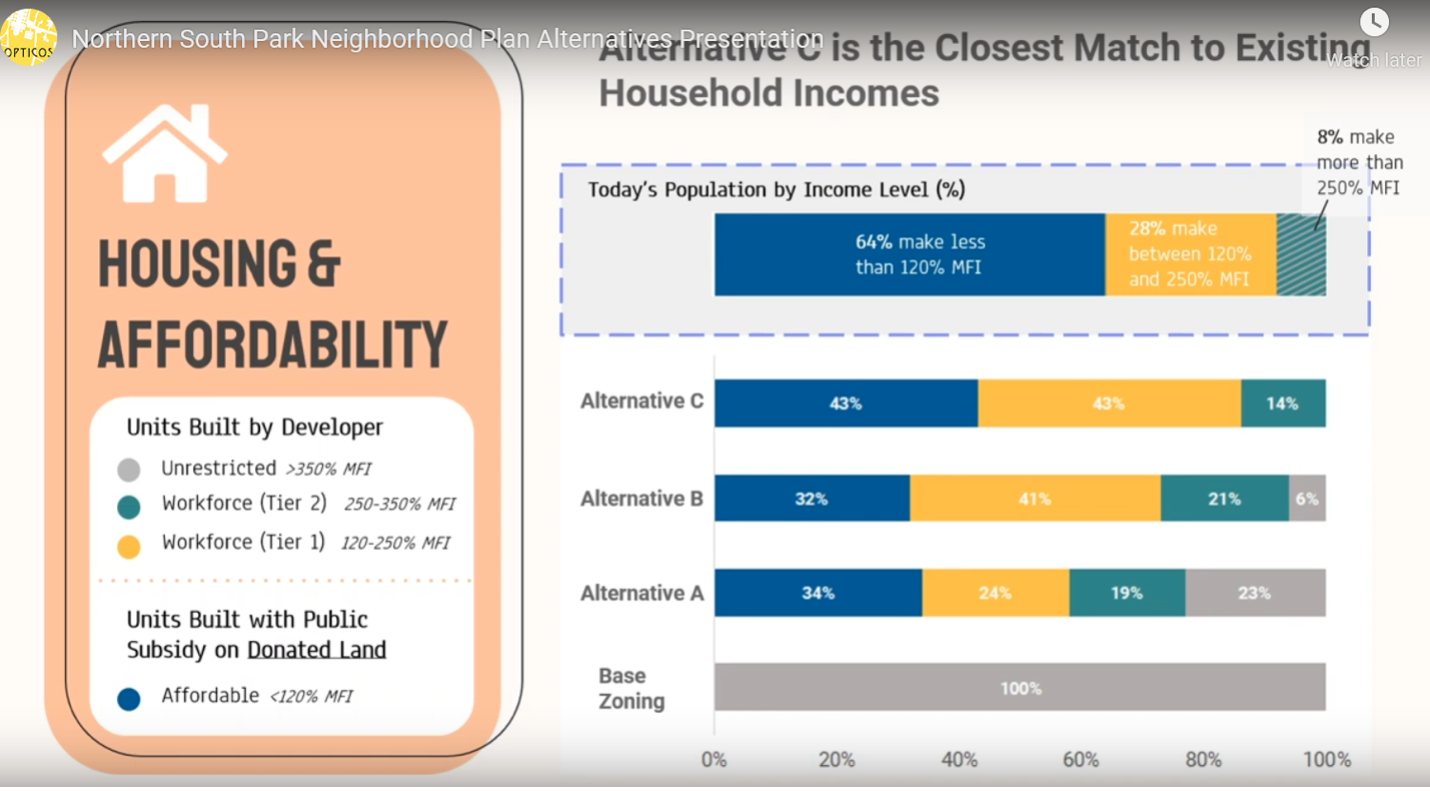
Opticos presentation showing how the alternatives aren’t very affordable to local workers. See more detail and find out which homes you could afford in the chart at the bottom of this post.
We hope the county will publish more information soon, so our community can understand who these homes would serve:
- How much would the “affordable” and “workforce” homes sell for? Opticos must have estimated sale prices as part of calculating the developers’ rate of return. Knowing what a “Workforce Tier 2” home might sell for is a critical data point for regular folks in the community to understand whether that home could ever be their home.
- What local professions could afford each of those price levels (e.g. doctors, nurses, teachers, line cooks – see examples below)?
2. The affordable homes might never get built.
The alternatives outline a structure where the landowners/developers can build the market-rate and high-end “workforce” homes (with no limit on sales prices) right away, but the “affordable” homes would only get built if and when our community raises an additional $100-500M of public subsidy (perhaps over 30 years). This is obviously a risky deal for our community. One solution is to phase construction so that affordable homes are built at the same time as, or proportional to, market-rate units. Otherwise, we could see many high-end homes built quickly, but no affordable homes for decades – or ever.
As the county prepares its report, we hope they’ll address:
- How likely is it that our community will invest $100-500M in the “public subsidy” to actually build the affordable homes? Where would those funds come from?
- What happens if our community does not raise that money?
3. The “open space” doesn’t work for wildlife permeability.
The current designs propose a central open space with a bike path running through it, forcing wildlife into the middle of the development and into conflict with cyclists / walkers / dogs. Unfortunately, this is counterproductive for the stated goal of wildlife permeability and leads to the potential for increased human-wildlife interactions. One solution would be to keep the bike path in the middle of the development but relocate the undeveloped open space to the southern and eastern boundaries, increasing the buffers along Central South Park and Flat Creek.
Another solution would be to establish a conservation corridor south of the new development. The influx of residents and cars from NSP will create more human and wildlife conflict. A greenway of agricultural conservation easements across Central South Park would provide connectivity for elk, deer, and other wildlife, and would balance the impacts of new development on our ecosystem. It is imperative that wildlife has alternatives for moving around the expanded urban footprint rather than through it. (Learn more about wildlife solutions for NSP on our website.)
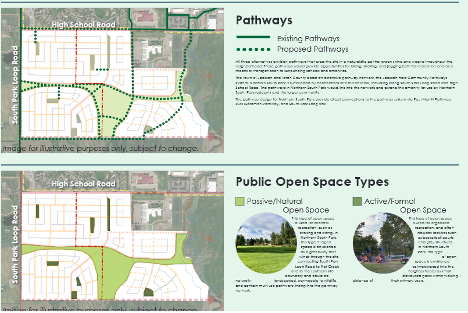
Opticos presentation showing potential open space locations
4. New roads could cause more sprawl and more traffic.
All the alternatives show a new Tribal Trail Connector Road and a new East-West Connector Road. The county’s modeling to date shows that building a Tribal Trail Connector Road would add traffic to the already-gridlocked Highway 22, without clear benefit to our community. Building a new East-West Connector road on the southern end of the property would be a perfect setup for more sprawling development to the south in another 10 or 20 years. Do you want to see all of South Park develop, one section at a time?
We hope the county will consider alternatives to handle traffic demand through transit or improvements to High School Road. Alternatively, if the East-West Connector is absolutely necessary for this development, the county could require conservation easements on the parcels directly south of the East-West Connector – thus preventing continued sprawl to the south (and as a co-benefit, increasing wildlife permeability).
Communities are built one decision at a time. This is a big decision.
Here are the number of homes proposed for each income level, in each alternative (we extrapolated the income levels from Opticos’ presentation):
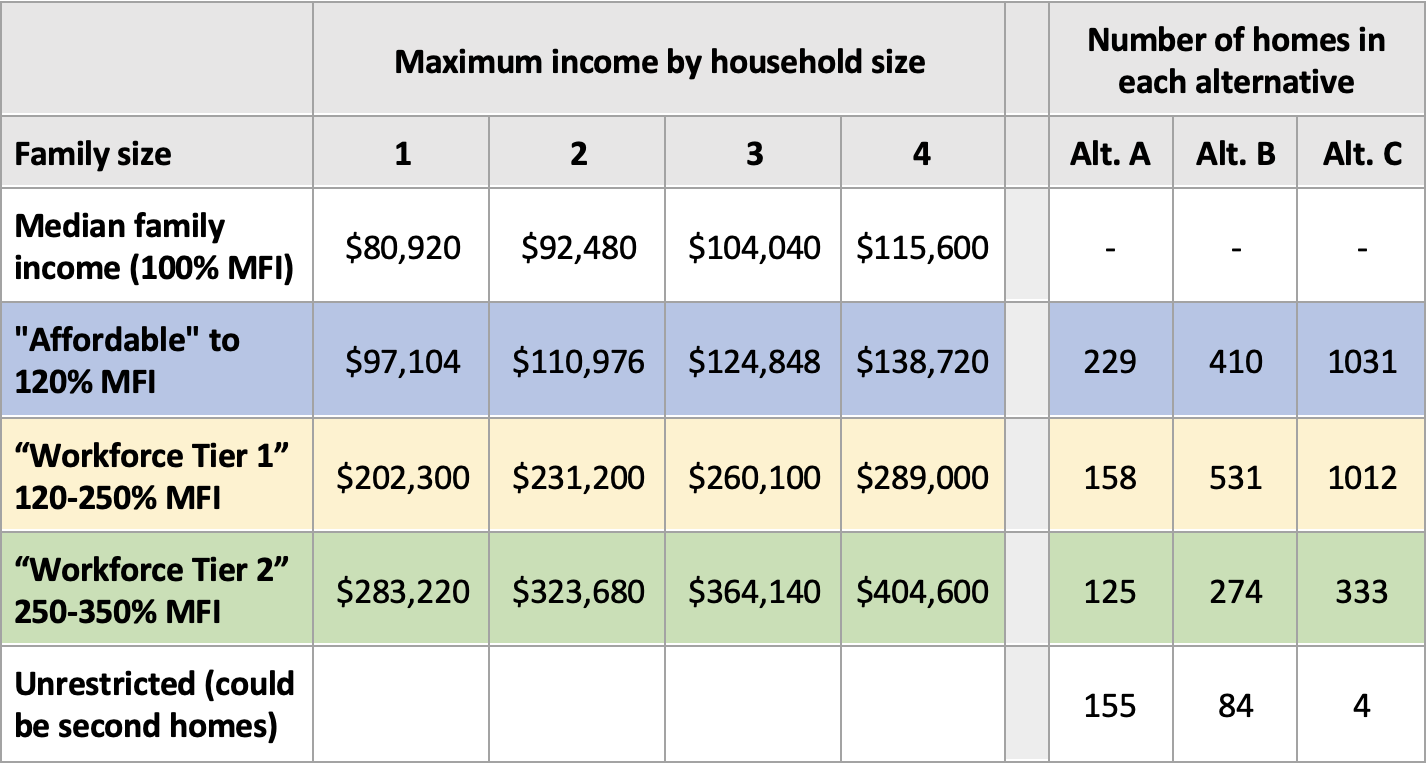
Where do you fall in that chart, and will you be able to afford these homes? Tell the county!
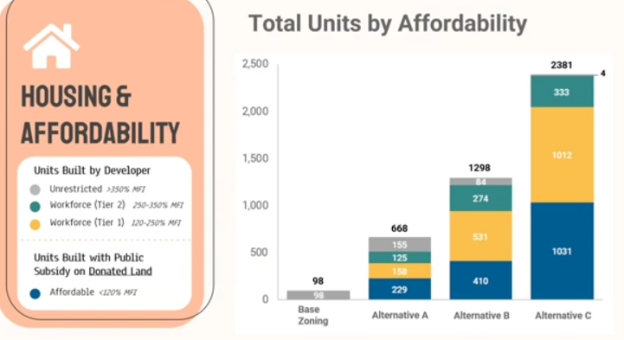
Opticos presentation showing the number of units at each proposed level of affordability

Housing costs vs incomes, from the 2021 Teton County Housing Supply Plan